
Pushing to your API
- Document
- Developers — Pushing to your API
- Chapters
- 9
- Source
- help.dronetag.cz/print/developers/data-push
Getting Started with Data Push
One way to access telemetry data from Dronetag devices is by letting our servers initiate the connection and push the data to yours. You can manage these connections through our Integration Portal, where you can configure everything yourself. This portal gives you full control over the integration settings, allowing you to select connection protocols like HTTP webhooks, MQTT, TCP, or UDP. You can for example easily switch between your testing and production environments and adjust other settings as needed.
How to Access the Integration Portal
To set up Data Push integration, you'll need access to the portal, which is available for users subscribed to our Pro plan or for business partners participating in our cooperative projects. If you're interested in gaining access, reach out to us.
Access the portal at https://integrations.dronetag.app.
The user-friendly web interface makes it simple to configure your integration in just a few steps.
What Can You Configure?
Our integration framework is designed to be highly flexible, allowing you to customize many parameters for each integration without needing our help. Here’s what you can configure:
- Connection Protocol: Choose between HTTP webhooks, MQTT, TCP, or UDP.
- Target Address: Direct the data to your production or staging API endpoint—it’s your call.
- Output Format: Besides our standard JSON format, we support various UTM systems. See Protocols and Formats for recommended combinations.
- Traffic Throttling: To avoid overloading your servers, you can limit the number of requests at the cost of some latency.
- Authentication: Choose from various authentication methods, including HTTP Basic Authentication, custom HTTP headers, OAuth 2.0, and more.
- ... and more
Setting Up Your First Distribution Target
To start transferring data, you'll need to create a distribution target. This represents the service where you want to send your data. You can create multiple targets, but there is a limit. Once a target is created, our system will automatically distribute data until you deactivate or remove it.
- Log in to the Integration Portal with your Dronetag account, or create a new one.
- On the main page, you’ll see all the distributions you’ve created.
- Create a new distribution target by clicking the Add New button.
- Fill out the form to configure your target. The following sections on this page will help guide you through the setup.
- Save the target and allow a few minutes for the changes to take effect.
- You can check for communication or configuration errors by viewing the server logs. Find your newly created distribution on the main page and click View & Edit.
Pausing or Stopping the Distribution
To temporarily stop the data from being sent to your services, you can pause the distribution by marking it as inactive. If you no longer need the distribution, you can permanently delete it.
What’s Next?
- After setting up your integration, check if it's working properly.
- Learn more about our DUMP JSON format.
- If this integration method doesn’t suit your needs, check out our guide for choosing the best integration method.
Protocols and Formats
Each Data Push distribution combines two separate choices:
- Connection protocol - how Dronetag sends the data to your system.
- Output format - how each telemetry message is encoded.
Most formats are technically transport-independent, but not every combination is useful in practice. Choose the protocol based on how your system receives data, then choose a format that your target system can parse.
Recommended Combinations
| Product / integration name | Recommended protocol | Recommended output format | Typical settings |
|---|---|---|---|
| Custom HTTP API or webhook | HTTP Webhooks | DUMP JSON, DUMP JSON Typed or a partner-specific socket format | Use an HTTPS target URL, HTTP Basic Authentication or OAuth 2.0 if required, and custom headers for API keys or tenant IDs. |
| Custom MQTT telemetry feed | MQTT Client | DUMP JSON, DUMP JSON Typed or a partner-specific socket format | Use MQTT over TLS when available, username/password authentication, QoS selected by your broker requirements, and {msgtype} in the topic if you want message-type routing. |
| Custom TCP socket feed | TCP Socket | DUMP JSON, DUMP JSON Typed or a partner-specific socket format | Use TLS or mTLS when crossing public networks. Enable embedded metadata only if your receiver expects the wrapper. |
| Custom UDP socket feed | UDP Socket | DUMP JSON or DUMP JSON Typed or a partner-specific socket format | Use only when packet loss is acceptable. Add AES payload encryption if the receiver supports it and the network path is not trusted. |
| TAK Server / CoT feed | TCP Socket | Cursor on Target XML | Use TCP mTLS when the TAK deployment requires client certificates. |
| SAPIENT feed | TCP Socket | SAPIENT | Set TCP protocol mode to sapient, configure heartbeat interval when required, and use TLS/mTLS if the receiving node requires certificate security. |
Compatibility Matrix
| Output format | HTTP Webhooks | MQTT Client | TCP Socket | UDP Socket | Notes |
|---|---|---|---|---|---|
| DUMP JSON | Recommended | Recommended | Supported | Supported | Best default for custom integrations. |
| DUMP JSON Typed | Recommended | Recommended | Supported | Supported | Same as DUMP JSON, with a $type field in the payload. |
| Cursor on Target XML | Possible | Not supported | Recommended | Possible | Used by TAK-compatible systems. |
| SAPIENT | Not supported | Not supported | Recommended | Not supported | Requires the SAPIENT TCP protocol mode. |
Product Names
Some integrations are better known by the product or ecosystem name than by their protocol and format:
| Protocol + format | Product / integration name |
|---|---|
| HTTP Webhooks + DUMP JSON | Custom webhook / custom API integration |
| MQTT + DUMP JSON | Custom MQTT integration |
| TCP or UDP + Cursor on Target XML | TAK Server integration |
| TCP + SAPIENT | SAPIENT integration |
Portal Names and Security Options
The Integration Portal uses these connection labels:
| Portal connection type | Compatible authentication choices | Transport and payload security |
|---|---|---|
| HTTP Webhooks | HTTP Basic Authentication, OAuth 2.0 | HTTPS target URL |
| MQTT Client | HTTP Basic Authentication | MQTT over TLS, AES data encryption |
| TCP Socket | None | TLS/mTLS, AES data encryption |
| UDP Socket | None | AES data encryption |
You can also leave authentication empty when your receiver does not require it. In this table, HTTPS, MQTT over TLS, and TLS/mTLS are transport security options, and AES data encryption is a payload encryption option, not a login method. The portal label HTTP Basic Authentication is also used for MQTT username/password credentials.
mTLS settings are shown in the portal only for TCP Socket distributions. The portal accepts either separate PEM files or PKCS#12 .p12 bundles:
- PEM: CA certificate, client certificate, client private key, and optional client key passphrase.
- PKCS#12: truststore
.p12with one or more certificates used to verify the server, and client.p12with the client certificate and matching private key. Each bundle can have its own optional password. The portal converts both bundles to PEM before the integration uses them. - Verify host checks the server hostname against the TLS certificate.
The selected Data Source controls which messages a distribution target may receive before protocol or format conversion. See Message Coverage for details about which message types each output format can send.
The portal also exposes delivery controls:
- Keep reliable controls behavior when messages cannot be delivered.
- Throttle messages limits how often Dronetag sends data to your receiver.
- Allow mixed content allows multiple message types in one request where the selected output format supports it.
- Send empty payloads sends an empty request at the throttle interval even when no new telemetry is available. It requires throttling to be enabled.
Common Setting Bundles
HTTP Webhooks API
Use this for custom APIs, webhooks, and most partner API integrations.
Typical settings:
- Target URL starts with
https://. - Authentication is HTTP Basic Authentication, OAuth 2.0, a partner-specific method, or custom HTTP headers.
- Additional headers can carry API keys, tenant identifiers, or environment selectors.
MQTT Client
Use this when your infrastructure expects telemetry on MQTT topics.
Typical settings:
- Target URI and port point to your MQTT broker.
- Transport is
tcporwebsockets, depending on your broker. - Username/password authentication is configured when the broker requires it.
- Topic can include
{msgtype}for DUMP JSON routing. - QoS is usually
0or1, depending on whether low latency or delivery acknowledgement is more important.
TAK / CoT
Use this for TAK Server, ATAK, WinTAK, iTAK, or TAK-compatible middleware.
Typical settings:
- Output format is Cursor on Target XML.
- Protocol is usually TCP or UDP socket.
- TCP is preferred when you need connection state and better delivery behavior.
- UDP is common for simple CoT feeds where occasional packet loss is acceptable.
- mTLS can be enabled for TCP when your TAK Server requires client certificates.
SAPIENT
Use this only for systems that explicitly implement SAPIENT.
Typical settings:
- Protocol is TCP Socket.
- Output format is SAPIENT.
- TCP protocol mode is
sapient. - Heartbeat interval is configured when required by the receiving node.
- TLS or mTLS is enabled if required by the SAPIENT deployment.
Protocol Notes
HTTP Webhooks
HTTP is the best option when your system exposes an API endpoint. Dronetag sends POST requests to your target URL. The URL must start with http:// or https://.
Use plain HTTP only for development and testing. For production environments, HTTPS is strongly recommended.
HTTP can include metadata as headers, such as content type, message type, integration client ID, and public data visibility. You can also configure additional HTTP headers for your distribution.
Use HTTP for partner-specific API formats such as Altitude Angel, ASTRA, Highlander, and similar integrations.
MQTT Client
MQTT is the best option when your system already operates an MQTT broker and expects telemetry on topics. Dronetag connects as an MQTT client and publishes converted messages to the configured topic.
MQTT works well with JSON payloads. If you use DUMP JSON, you can include {msgtype} in the topic name to route UA telemetry, operator telemetry, system telemetry, and operation updates to separate topics.
TCP Socket
TCP is useful when the target system expects a persistent socket connection. It is also the recommended protocol for SAPIENT and one of the recommended protocols for TAK Server.
For SAPIENT, configure the TCP protocol mode as sapient. This enables the SAPIENT registration flow and length-prefixed binary messages.
TCP can also use TLS or mutual TLS when your target requires certificate-based security.
UDP Socket
UDP is useful for simple fire-and-forget delivery, especially when integrating with systems that already accept UDP feeds, such as some TAK deployments.
Because UDP does not provide delivery confirmation, use TCP or HTTP when your integration requires stronger delivery guarantees.
Metadata
HTTP sends metadata as request headers. MQTT, TCP, and UDP can optionally embed metadata into the payload for formats where that is useful.
Embedded metadata wraps the payload in an object with data and metadata fields. Use it only if your receiver is built to parse that wrapper.
When Unsure
For custom integrations, start with:
- HTTP Webhooks + DUMP JSON if your service can expose an HTTPS endpoint.
- MQTT + DUMP JSON if your infrastructure already uses MQTT.
- TCP + Cursor on Target XML if you are integrating with TAK Server.
- TCP + SAPIENT if your target system explicitly requires SAPIENT.
Data Sources Explained
While configuring your integration distribution in our integration portal, you will encounter the field "data source". This article provides a detailed explanation of what data sources are and how they can be utilized in your integration.
The data source controls which messages are eligible for a distribution target. The selected output format can further limit which eligible message types are actually sent. See Message Coverage for details.
My Account
Requirements: None
Data shared: Only the data associated with the distribution owner account
This data source is available to anyone using the integration portal. It is primarily intended for initial testing and evaluation. When selected, it provides access only to the data associated with the same account as the account creating the distribution (owner). Only devices registered to this account are visible, ensuring privacy and isolation from other users' data.
Device Group
Requirements: Existing device group related to an order of Dronetag devices
Data shared: All data, regardless of privacy settings or registration status
Device Group is intended for customers who have entered into a partnership with Dronetag and have purchased a group of devices. These devices are assigned to a pre-defined static group, which can be selected as a data source. The group membership is fixed and can only be changed upon request. Device groups are not visible or accessible to regular Dronetag users.
Partner Integration
Requirements: Partnership registration with Dronetag
Data shared: Opt-in by users, all data regardless of privacy settings
Partner Integrations are visible and accessible to users, who have full control over which integrations can access their data.
Users can allow or deny access to their data for each integration via the Dronetag App, in the "Integrations" section. This means that users can choose to share their data with specific integrations while keeping it private from others.
Partner Integrations can be configured to prompt users for an arbitrary token, identifier, or authorization value when enabling the integration in the Dronetag App. This allows users to enter credentials or identifiers required by the third-party service, which can reliably associate Dronetag users with their own user accounts or authorization systems.
The partner integration approach increases transparency and user awareness, allowing users to remain in private mode while still enabling third-party integrations. This is the recommended approach for most integrations.
Each partner integration requires the following information to be provided, which is then displayed in the Dronetag App 'Integrations' section:
- Full/display company/app name
- Logo URL (optional) – horizontal logo to improve brand recognition
- Description (optional) – short text describing your company/app/platform
- Website URL - link to your website
- Manager account – Dronetag account that will be allowed to select this partner integration as a data source in the integration portal
- Client ID configuration (optional) - a preference if you wish to require users to enter identification before enabling the integration
All Public Data (Deprecated)
Previous requirements: None
Data shared: All public data of all Dronetag users (but not private data)
This data source previously allowed all public data available in the Dronetag App to be shared with any third party via the integration portal.
To enhance user experience and privacy, this option has been deprecated and is no longer available.
HTTP Webhooks
The most common distribution type uses HTTP protocol to distribute the data.
For each telemetry message, a new HTTP request is created and sent to your service's HTTP server.
Specific configuration
Currently, only additional HTTP headers can be set using the specific configuration.
| Name | Description | Valid values |
|---|---|---|
target_additional_http_headers | Additional HTTP headers sent with each request | JSON object |
Example specific configuration
Following is an example of configuration JSON where custom headers are used to send a Bearer token with each request.
{
  "target_additional_http_headers": {
    "X-My-Custom-Id": "12345"
  }
}
MQTT Client
If your service is equipped with an MQTT Broker Server, you can use the MQTT Client type to connect to your server and publish the data.
Specific configuration
| Name | Description | Valid values |
|---|---|---|
mqtt_dist_client_id | MQTT Client ID | Any string |
mqtt_dist_transport | Transport type used to connect to the server | tcp or websockets |
mqtt_dist_tls | Should TLS be used to connect? | true or false |
mqtt_dist_json_datastream_topic | Topic used for sending telemetry messages | Any string |
mqtt_dist_publish_qos_default | QoS parameter of messages sent from the client | Any integer number |
embed_metadata | Adds message metadata like account_visibility or integration_client_id to payload | true or false |
Example specific configuration
Following is an example of configuration JSON.
{
  "mqtt_dist_client_id": "dronetag_0001",
  "mqtt_dist_transport": "tcp",
  "mqtt_dist_tls": false,
  "mqtt_dist_json_datastream_topic": "dronetag/telemetry/{msgtype}",
  "mqtt_dist_publish_qos_default": 0
}
Using {msgtype} in topic name
If you use Dronetag DUMP format and you'd like to send different types of messages to different topics, you can use the {msgtype} placeholder in the topic name. It will be replaced with the actual message type before sending. For example, if the message type is "UA telemetry", the topic dronetag/telemetry/{msgtype} will become dronetag/telemetry/tele-ua.
Available message types are:
tele-ua- UA telemetry messagestele-operator- Operator telemetry messagestele-system- System telemetry messagesoperation-update- Operation update messages
Refer to the 'Understanding DUMP' page for more information about the message types.
Configuration recommendations
- Usually a valid Target Port is required to be set.
TCP & UDP Sockets
This distribution type uses plain TCP or UDP socket to distribute the data.
Specific configuration
| Name | Description | Valid values |
|---|---|---|
embed_metadata | Adds message metadata like account_visibility or integration_client_id to payload | true or false |
Example specific configuration
Following is an example of configuration JSON
{
  "embed_metadata": true
}
Configuration recommendations
- The 'Target port' must be set
- We recommend using the AES cipher authorization type to keep the traffic secure
Message Coverage
Data Push uses two separate filters before sending data to your target:
- The Data Source setting controls which messages are eligible for the distribution target.
- The Output Format setting controls which eligible message types can be represented and sent.
For example, a target using the My account data source can receive only messages accessible to that account. If the same target uses a partner-specific UAV-position format, only eligible aircraft position messages are sent because that format cannot represent operator position, system telemetry, or operation updates.
Message Types by Output Format
| Data type | DUMP JSON / DUMP JSON Typed | Cursor on Target XML | SAPIENT | Partner-specific UAV-position formats |
|---|---|---|---|---|
| UA telemetry | Sent as tele-ua | Sent as aircraft CoT events | Sent as SAPIENT detections | Sent when the format can represent the position message |
| Operator position telemetry | Sent as tele-operator | Sent as operator CoT events | Not sent | Not sent |
| System telemetry | Sent as tele-system by default | Sent as system CoT events | Not sent | Not sent |
| Operation updates | Sent as operation-update | Not sent | Not sent | Not sent |
| ADS-B, UAT, FLARM, and OGN traffic | Not sent | Not sent | Not sent | Not sent |
DUMP JSON and DUMP JSON Typed are the best choices when your target needs the complete Data Push message set.
System telemetry can be disabled for a target with the distribute_system_telemetry connection setting.
Monitoring Your Distribution
After setting up your first distribution, your next step will likely be monitoring to ensure it's working correctly. You can do this in several ways.
Check the Status in the Integration Portal
To view the current status of your distribution, visit the Integration Portal and confirm that your distribution is enabled and configured correctly.
Click on the View & Edit link to see details such as uptime and statistics for the last 24 hours. You'll also see a small chart that provides a quick overview of how many messages were sent through this distribution during that period.
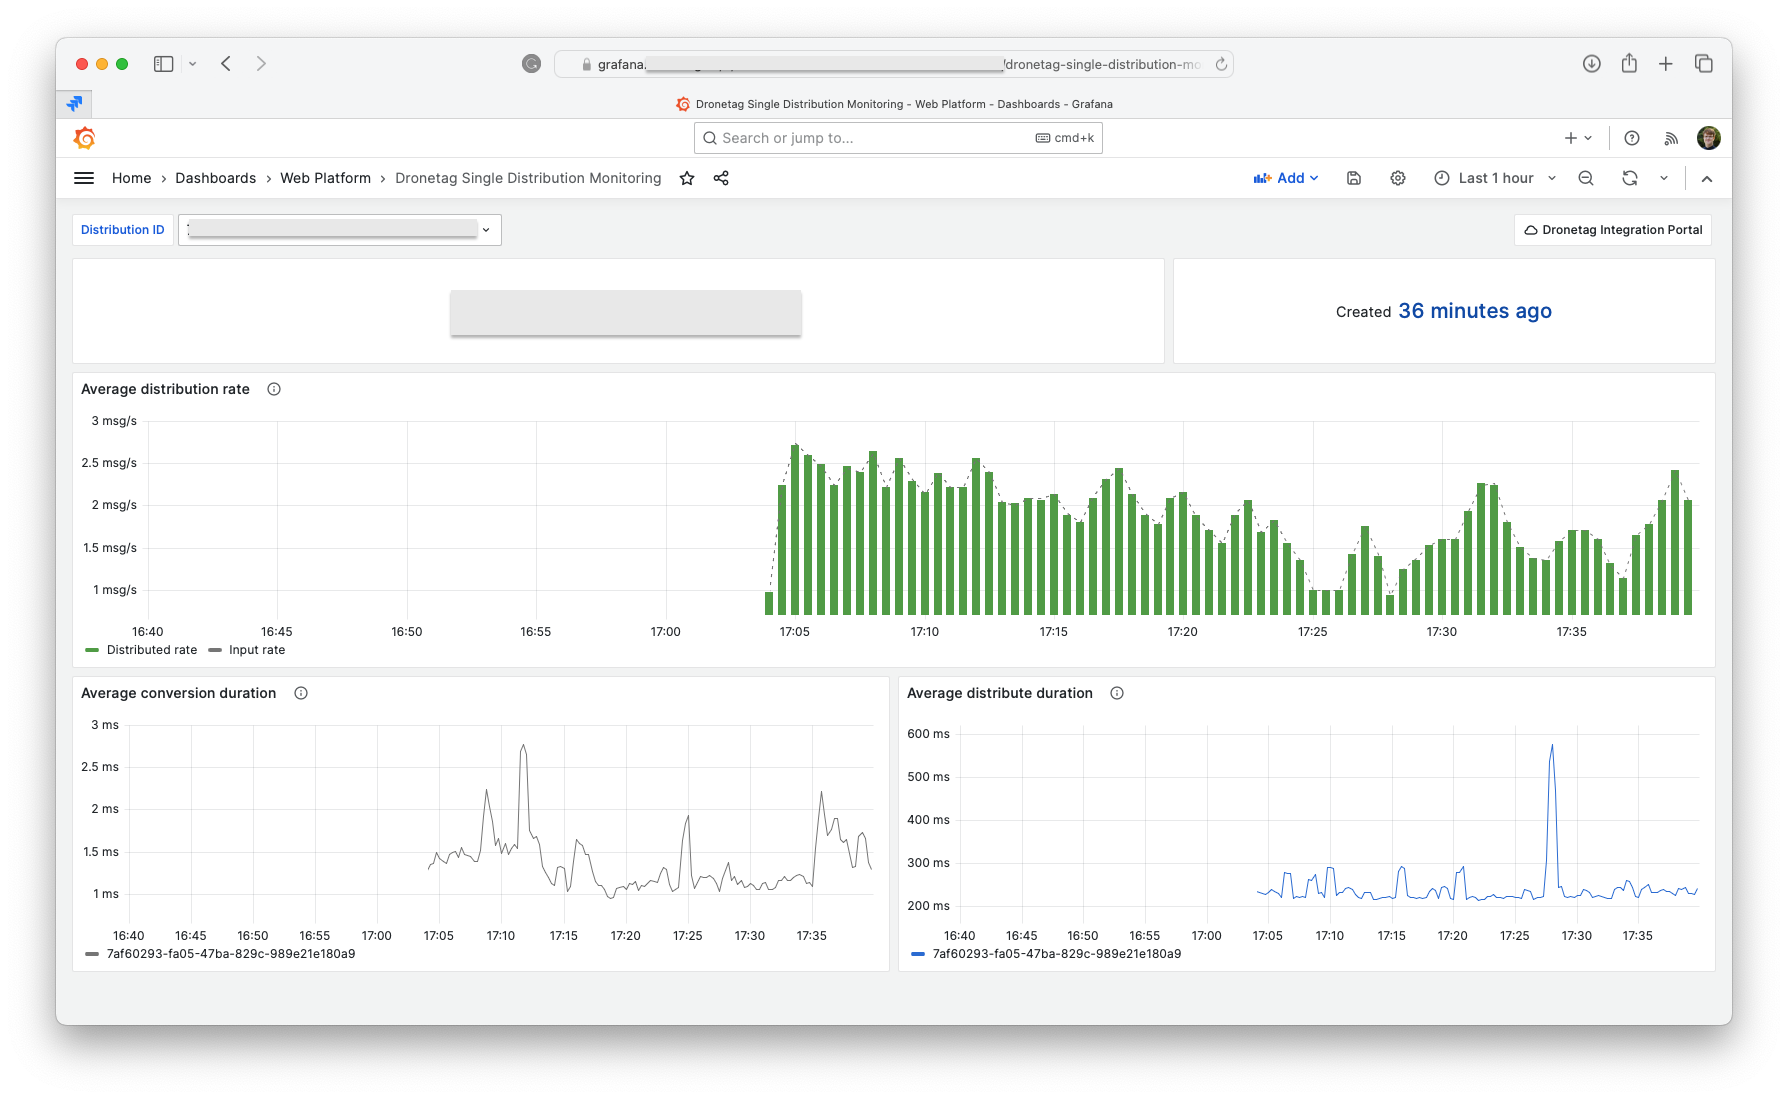
Monitor the Status with Prometheus / OpenTelemetry
If you want more advanced monitoring, including historical data and alerts, you can integrate Prometheus to scrape metrics from our system. This feature is available for all integration portal users and provides detailed data for each running integration.
To visualize the data, we recommend using Grafana.
Getting the Metrics URL
- Log in to the Integration Portal with your Dronetag account, or create a new one.
- Find the distribution target you're interested in and click View & Edit.
- Click the Get Prometheus Metrics button.
- You’ll see the metrics in Prometheus/OpenMetrics format.
- Use your preferred tool to scrape this URL periodically (see the next section for more details).
The URL format will look like this:
https://relay.dronetag.app/metrics/[[your_distribution_id]]
Make sure to note your distribution ID.
Scraping Metrics with Prometheus
Prometheus is an open-source monitoring system that can scrape our metrics export. To learn more and find installation instructions, refer to the official Prometheus documentation.
Here’s a recommended configuration to start scraping our metrics:
global:
  scrape_interval: 10s
scrape_configs:
  - job_name: 'dronetag_distribution_metrics'
    scrape_interval: 10s
    metrics_path: '/metrics/[[your_distribution_id]]'
    static_configs:
      - targets: ['relay.dronetag.app']
This configuration will scrape metrics every 10 seconds from the URL: https://relay.dronetag.app/metrics/[[your_distribution_id]].
Available Metrics
| Name | Description |
|---|---|
relay_messages_read_total | Total number of messages read on the input |
relay_messages_distributed_total | Total number of messages distributed. This may be lower than the input due to filters or delivery failures. |
relay_message_conversion_seconds | Average time to convert a message to the selected output format (in seconds) |
relay_message_distribution_seconds | Average time to distribute a message to your target (in seconds), mostly representing server latency. |
Visualizing Data with Grafana
Grafana is an open-source monitoring and analytics tool that works with Prometheus as a data source.
Check out the guide 'Get started with Grafana and Prometheus' to learn how to install Grafana and set up Prometheus as a data source.
Example Grafana Dashboard
We provide a basic Grafana dashboard example. You can import the JSON file into your Grafana instance and modify it to suit your needs.
Details
{ "annotations": { "list": [ { "builtIn": 1, "datasource": { "type": "grafana", "uid": "-- Grafana --" }, "enable": true, "hide": true, "iconColor": "rgba(0, 211, 255, 1)", "name": "Annotations & Alerts", "target": { "limit": 100, "matchAny": false, "tags": [], "type": "dashboard" }, "type": "dashboard" } ] }, "editable": true, "fiscalYearStartMonth": 0, "graphTooltip": 0, "id": 47, "links": [ { "asDropdown": false, "icon": "cloud", "includeVars": false, "keepTime": false, "tags": [], "targetBlank": false, "title": "Dronetag Integration Portal", "tooltip": "", "type": "link", "url": "https://integrations.dronetag.app" } ], "liveNow": false, "panels": [ { "datasource": { "type": "prometheus", "uid": "aRT0ZzYnk" }, "fieldConfig": { "defaults": { "color": { "mode": "thresholds" }, "mappings": [], "thresholds": { "mode": "absolute", "steps": [ { "color": "dark-purple", "value": null } ] }, "unit": "string" }, "overrides": [] }, "gridPos": { "h": 3, "w": 16, "x": 0, "y": 0 }, "id": 3, "options": { "colorMode": "value", "graphMode": "none", "justifyMode": "auto", "orientation": "horizontal", "reduceOptions": { "calcs": [ "lastNotNull" ], "fields": "/^relay_distribution_name$/", "values": false }, "text": { "valueSize": 40 }, "textMode": "value" }, "pluginVersion": "10.1.1", "targets": [ { "datasource": { "type": "prometheus", "uid": "aRT0ZzYnk" }, "editorMode": "code", "expr": "relay_messages_read_created{distribution_id=\"$distribution_id\"}", "format": "table", "instant": false, "legendFormat": "__auto", "range": true, "refId": "A" } ], "transformations": [], "type": "stat" }, { "datasource": { "type": "prometheus", "uid": "aRT0ZzYnk" }, "fieldConfig": { "defaults": { "color": { "mode": "thresholds" }, "mappings": [], "thresholds": { "mode": "absolute", "steps": [ { "color": "green", "value": null }, { "color": "dark-blue", "value": 80 } ] }, "unit": "dateTimeFromNow" }, "overrides": [] }, "gridPos": { "h": 3, "w": 8, "x": 16, "y": 0 }, "id": 2, "options": { "colorMode": "value", "graphMode": "none", "justifyMode": "center", "orientation": "horizontal", "reduceOptions": { "calcs": [ "lastNotNull" ], "fields": "/^Created$/", "values": false }, "textMode": "value_and_name" }, "pluginVersion": "10.1.1", "targets": [ { "datasource": { "type": "prometheus", "uid": "aRT0ZzYnk" }, "editorMode": "code", "expr": "relay_messages_read_created{distribution_id=\"$distribution_id\"}", "format": "time_series", "instant": false, "legendFormat": "Created at", "range": true, "refId": "A" } ], "transformations": [ { "id": "calculateField", "options": { "alias": "Created", "binary": { "left": "Created at", "operator": "*", "reducer": "sum", "right": "1000" }, "mode": "binary", "reduce": { "reducer": "sum" }, "replaceFields": true } } ], "type": "stat" }, { "datasource": { "type": "prometheus", "uid": "aRT0ZzYnk" }, "description": "Average rates of sent (distributed) messages. Dotted line shows source input rate, which can be higher if there are filters applied (such as filter to specific device group).", "fieldConfig": { "defaults": { "color": { "mode": "palette-classic" }, "custom": { "axisCenteredZero": false, "axisColorMode": "text", "axisLabel": "", "axisPlacement": "auto", "barAlignment": 0, "drawStyle": "bars", "fillOpacity": 100, "gradientMode": "none", "hideFrom": { "legend": false, "tooltip": false, "viz": false }, "insertNulls": false, "lineInterpolation": "linear", "lineWidth": 0, "pointSize": 5, "scaleDistribution": { "type": "linear" }, "showPoints": "never", "spanNulls": false, "stacking": { "group": "A", "mode": "none" }, "thresholdsStyle": { "mode": "off" } }, "mappings": [], "thresholds": { "mode": "absolute", "steps": [ { "color": "green", "value": null }, { "color": "red", "value": 80 } ] }, "unit": "mps" }, "overrides": [ { "matcher": { "id": "byName", "options": "Input rate" }, "properties": [ { "id": "custom.lineWidth", "value": 1 }, { "id": "custom.lineStyle", "value": { "dash": [ 2, 6 ], "fill": "dot" } }, { "id": "color", "value": { "mode": "fixed" } }, { "id": "custom.drawStyle", "value": "line" }, { "id": "custom.fillOpacity", "value": 0 } ] } ] }, "gridPos": { "h": 8, "w": 24, "x": 0, "y": 3 }, "id": 1, "interval": "15s", "maxDataPoints": 128, "options": { "legend": { "calcs": [], "displayMode": "list", "placement": "bottom", "showLegend": true }, "tooltip": { "mode": "single", "sort": "none" } }, "targets": [ { "datasource": { "type": "prometheus", "uid": "aRT0ZzYnk" }, "editorMode": "code", "expr": "sum(rate(relay_messages_distributed_total{distribution_id=\"$distribution_id\"}[$__rate_interval])) by (distribution_id)", "instant": false, "legendFormat": "Distributed rate", "range": true, "refId": "A" }, { "datasource": { "type": "prometheus", "uid": "aRT0ZzYnk" }, "editorMode": "code", "expr": "sum(rate(relay_messages_read_total{distribution_id=\"$distribution_id\"}[$__rate_interval])) by (distribution_id)", "hide": false, "instant": false, "legendFormat": "Input rate", "range": true, "refId": "B" } ], "title": "Average distribution rate", "type": "timeseries" }, { "datasource": { "type": "prometheus", "uid": "aRT0ZzYnk" }, "description": "The duration of how long it takes to convert the source input data to the output format. Includes filtering or other data pre-processing.", "fieldConfig": { "defaults": { "color": { "mode": "fixed", "seriesBy": "last" }, "custom": { "axisCenteredZero": false, "axisColorMode": "text", "axisLabel": "", "axisPlacement": "auto", "barAlignment": 0, "drawStyle": "line", "fillOpacity": 0, "gradientMode": "none", "hideFrom": { "legend": false, "tooltip": false, "viz": false }, "insertNulls": false, "lineInterpolation": "linear", "lineWidth": 1, "pointSize": 5, "scaleDistribution": { "type": "linear" }, "showPoints": "auto", "spanNulls": false, "stacking": { "group": "A", "mode": "none" }, "thresholdsStyle": { "mode": "line" } }, "mappings": [], "thresholds": { "mode": "absolute", "steps": [ { "color": "blue", "value": null } ] }, "unit": "s" }, "overrides": [] }, "gridPos": { "h": 8, "w": 12, "x": 0, "y": 11 }, "id": 4, "interval": "15s", "options": { "legend": { "calcs": [], "displayMode": "list", "placement": "bottom", "showLegend": true }, "tooltip": { "mode": "single", "sort": "none" } }, "targets": [ { "datasource": { "type": "prometheus", "uid": "aRT0ZzYnk" }, "editorMode": "code", "expr": "sum(rate(relay_message_conversion_seconds_sum{distribution_id=\"$distribution_id\"}[$__rate_interval]) / rate(relay_message_conversion_seconds_count{distribution_id=\"$distribution_id\"}[$__rate_interval])) by (distribution_id)", "instant": false, "legendFormat": "__auto", "range": true, "refId": "A" } ], "title": "Average conversion duration", "type": "timeseries" }, { "datasource": { "type": "prometheus", "uid": "aRT0ZzYnk" }, "description": "The duration of how long it takes to distribute the data. The largest part is usually the server latency. Some distribution types can be missing a support for this metric.", "fieldConfig": { "defaults": { "color": { "mode": "thresholds", "seriesBy": "max" }, "custom": { "axisCenteredZero": false, "axisColorMode": "text", "axisLabel": "", "axisPlacement": "auto", "barAlignment": 0, "drawStyle": "line", "fillOpacity": 0, "gradientMode": "none", "hideFrom": { "legend": false, "tooltip": false, "viz": false }, "insertNulls": false, "lineInterpolation": "linear", "lineWidth": 1, "pointSize": 5, "scaleDistribution": { "type": "linear" }, "showPoints": "auto", "spanNulls": false, "stacking": { "group": "A", "mode": "none" }, "thresholdsStyle": { "mode": "dashed" } }, "mappings": [], "thresholds": { "mode": "absolute", "steps": [ { "color": "blue", "value": null }, { "color": "dark-orange", "value": 0.7 }, { "color": "semi-dark-red", "value": 1 } ] }, "unit": "s" }, "overrides": [] }, "gridPos": { "h": 8, "w": 12, "x": 12, "y": 11 }, "id": 5, "interval": "15s", "options": { "legend": { "calcs": [], "displayMode": "list", "placement": "bottom", "showLegend": true }, "tooltip": { "mode": "single", "sort": "none" } }, "targets": [ { "datasource": { "type": "prometheus", "uid": "aRT0ZzYnk" }, "editorMode": "code", "expr": "sum(rate(relay_message_distribution_seconds_sum{distribution_id=\"$distribution_id\"}[$__rate_interval]) / rate(relay_message_distribution_seconds_count{distribution_id=\"$distribution_id\"}[$__rate_interval])) by (distribution_id)", "instant": false, "legendFormat": "__auto", "range": true, "refId": "A" } ], "title": "Average distribute duration", "type": "timeseries" } ], "refresh": "", "schemaVersion": 38, "style": "dark", "tags": [ "dronetag" ], "templating": { "list": [ { "current": { "selected": false, "text": "cc2129b7-30e4-469e-8b13-92e7e097d528", "value": "cc2129b7-30e4-469e-8b13-92e7e097d528" }, "datasource": { "type": "prometheus", "uid": "aRT0ZzYnk" }, "definition": "label_values(relay_messages_read_total,distribution_id)", "hide": 0, "includeAll": false, "label": "Distribution ID", "multi": false, "name": "distribution_id", "options": [], "query": { "query": "label_values(relay_messages_read_total,distribution_id)", "refId": "PrometheusVariableQueryEditor-VariableQuery" }, "refresh": 1, "regex": "", "skipUrlSync": false, "sort": 0, "type": "query" } ] }, "time": { "from": "now-1h", "to": "now" }, "timepicker": { "nowDelay": "", "refresh_intervals": [ "5s", "10s", "30s", "1m", "5m" ] }, "timezone": "", "title": "Dronetag Single Distribution Monitoring", "uid": "f2370455-bdac-4098-baf5-ea8857bc199d", "version": 5, "weekStart": "" }
Troubleshooting
If you're encountering issues with your Data Push integration or distribution setup, this guide will help you identify and resolve common problems.
Common Issues and Solutions
1. Distribution Not Sending Data
If your distribution has been set up but no data is being sent, try the following steps:
- Check Distribution Status: Log in to the Integration Portal and make sure your distribution is active and properly configured. Look for errors or warnings in the logs.
- Verify Target Address: Ensure that the target address (API endpoint, MQTT broker, etc.) is correct. Test the connection to make sure your service is reachable.
- Firewall or Network Restrictions: Confirm that no firewall or network rules are blocking incoming data from our servers. Make sure the necessary ports are open (especially when using custom ports for TCP/UDP).
2. Data Delays or High Latency
If data is delayed or experiencing high latency, the issue might be related to:
- Traffic Throttling: Check if you've configured traffic throttling in the Integration Portal. Highly throttled set-ups can increase latency.
- Network Performance: Analyze your server's network performance and response times. High latency can sometimes be due to slow processing on your server. You can use our Prometheus metrics monitoring to check the request latency against your servers.
3. Authentication Failures
If your distribution is failing due to authentication errors:
- Check Authentication Method: Verify that the correct authentication method (HTTP Basic Authentication, OAuth 2.0, custom headers, etc.) is configured in the Integration Portal.
- Credentials: Ensure your API credentials or tokens are up-to-date and correctly set in your target service.
4. Failed Message Delivery
If the system is failing to deliver messages, or if you notice a lower count of distributed messages compared to input messages:
- Check Filters: The system may be filtering out certain messages based on your configuration. Review the Data Source configuration item.
- Review Server Logs: Look at the distribution server logs for any error messages or warnings. You can access these through the Integration Portal by clicking View & Edit on the distribution.
- Connection Issues: If the target service is down or unreachable, the system will not be able to deliver messages. Make sure your service is online and available.
5. Prometheus Metrics Not Showing Up
If you're using Prometheus to scrape metrics but aren't seeing any data:
- Metrics URL: Double-check the metrics URL in the Prometheus configuration. Ensure it's in the correct format:
https://relay.dronetag.app/metrics/[[your_distribution_id]]. - Prometheus Configuration: Review your
prometheus.ymlconfiguration file to confirm that the metrics path is correct and that Prometheus is scraping at the correct interval. - Distribution Errors: If distribution cannot start properly or is failing, the metrics endpoint can usually be empty. Check the distribution server logs if it's running properly.
Need More Help?
If these steps don’t resolve your issue, feel free to contact our support team for assistance. Make sure to include any relevant details, such as error logs or screenshots, to help us quickly diagnose the problem.
Source pages
Every chapter of this document is a page of the Dronetag help site. Use these addresses to reach the latest version.
- 1Getting startedhelp.dronetag.cz/developers/data-push/getting-started
- 2Protocols and formatshelp.dronetag.cz/developers/data-push/protocols-and-formats
- 3Data Sources Explainedhelp.dronetag.cz/developers/data-push/data-sources
- 4HTTP Webhookshelp.dronetag.cz/developers/data-push/distribution-types/http
- 5MQTT Clienthelp.dronetag.cz/developers/data-push/distribution-types/mqtt
- 6TCP & UDP Socketshelp.dronetag.cz/developers/data-push/distribution-types/tcp
- 7Message Coveragehelp.dronetag.cz/developers/data-push/message-coverage
- 8Monitoring Your Distributionhelp.dronetag.cz/developers/data-push/monitoring
- 9Troubleshootinghelp.dronetag.cz/developers/data-push/troubleshooting