
Monitorování distribuce
Po nastavení první distribuce budete nejspíš chtít sledovat, zda funguje správně. Můžete to dělat několika způsoby.
Kontrola stavu v portálu integrací
Aktuální stav distribuce zjistíte v portálu integrací, kde ověříte, že je distribuce zapnutá a správně nakonfigurovaná.
Po kliknutí na odkaz View & Edit uvidíte podrobnosti, jako je doba provozu (uptime) a statistiky za posledních 24 hodin. Zobrazí se i malý graf s rychlým přehledem, kolik zpráv touto distribucí za tu dobu prošlo.
Monitorování stavu přes Prometheus / OpenTelemetry
Pokud chcete pokročilejší monitorování včetně historických dat a upozornění, můžete napojit Prometheus, který bude z našeho systému sbírat metriky. Tato funkce je dostupná všem uživatelům portálu integrací a poskytuje podrobná data o každé běžící integraci.
K vizualizaci dat doporučujeme Grafanu.
Získání URL s metrikami
- Přihlaste se do portálu integrací svým účtem Dronetag, nebo si vytvořte nový.
- Najděte cíl distribuce, který vás zajímá, a klikněte na View & Edit.
- Klikněte na tlačítko Get Prometheus Metrics.
- Zobrazí se metriky ve formátu Prometheus/OpenMetrics.
- Tuto URL pravidelně stahujte nástrojem, který vám vyhovuje (podrobnosti v další sekci).
URL vypadá takto:
https://relay.dronetag.app/metrics/[[your_distribution_id]]
Poznamenejte si ID své distribuce.
Sběr metrik pomocí Promethea
Prometheus je open-source monitorovací systém, který umí náš export metrik sbírat (scrape). Více informací a návod k instalaci najdete v oficiální dokumentaci Promethea.
Doporučená konfigurace, se kterou můžete začít naše metriky sbírat:
global:
  scrape_interval: 10s
scrape_configs:
  - job_name: 'dronetag_distribution_metrics'
    scrape_interval: 10s
    metrics_path: '/metrics/[[your_distribution_id]]'
    static_configs:
      - targets: ['relay.dronetag.app']
Tato konfigurace sbírá metriky každých 10 sekund z URL https://relay.dronetag.app/metrics/[[your_distribution_id]].
Dostupné metriky
| Název | Popis |
|---|---|
relay_messages_read_total | Celkový počet zpráv přečtených na vstupu |
relay_messages_distributed_total | Celkový počet distribuovaných zpráv. Může být nižší než na vstupu kvůli filtrům nebo neúspěšnému doručení. |
relay_message_conversion_seconds | Průměrná doba převodu zprávy do zvoleného výstupního formátu (v sekundách) |
relay_message_distribution_seconds | Průměrná doba doručení zprávy do vašeho cíle (v sekundách), z velké části odpovídá latenci serveru. |
Vizualizace dat v Grafaně
Grafana je open-source nástroj pro monitorování a analýzu dat, který umí Prometheus používat jako zdroj dat.
Jak Grafanu nainstalovat a nastavit v ní Prometheus jako zdroj dat, popisuje návod 'Get started with Grafana and Prometheus'.
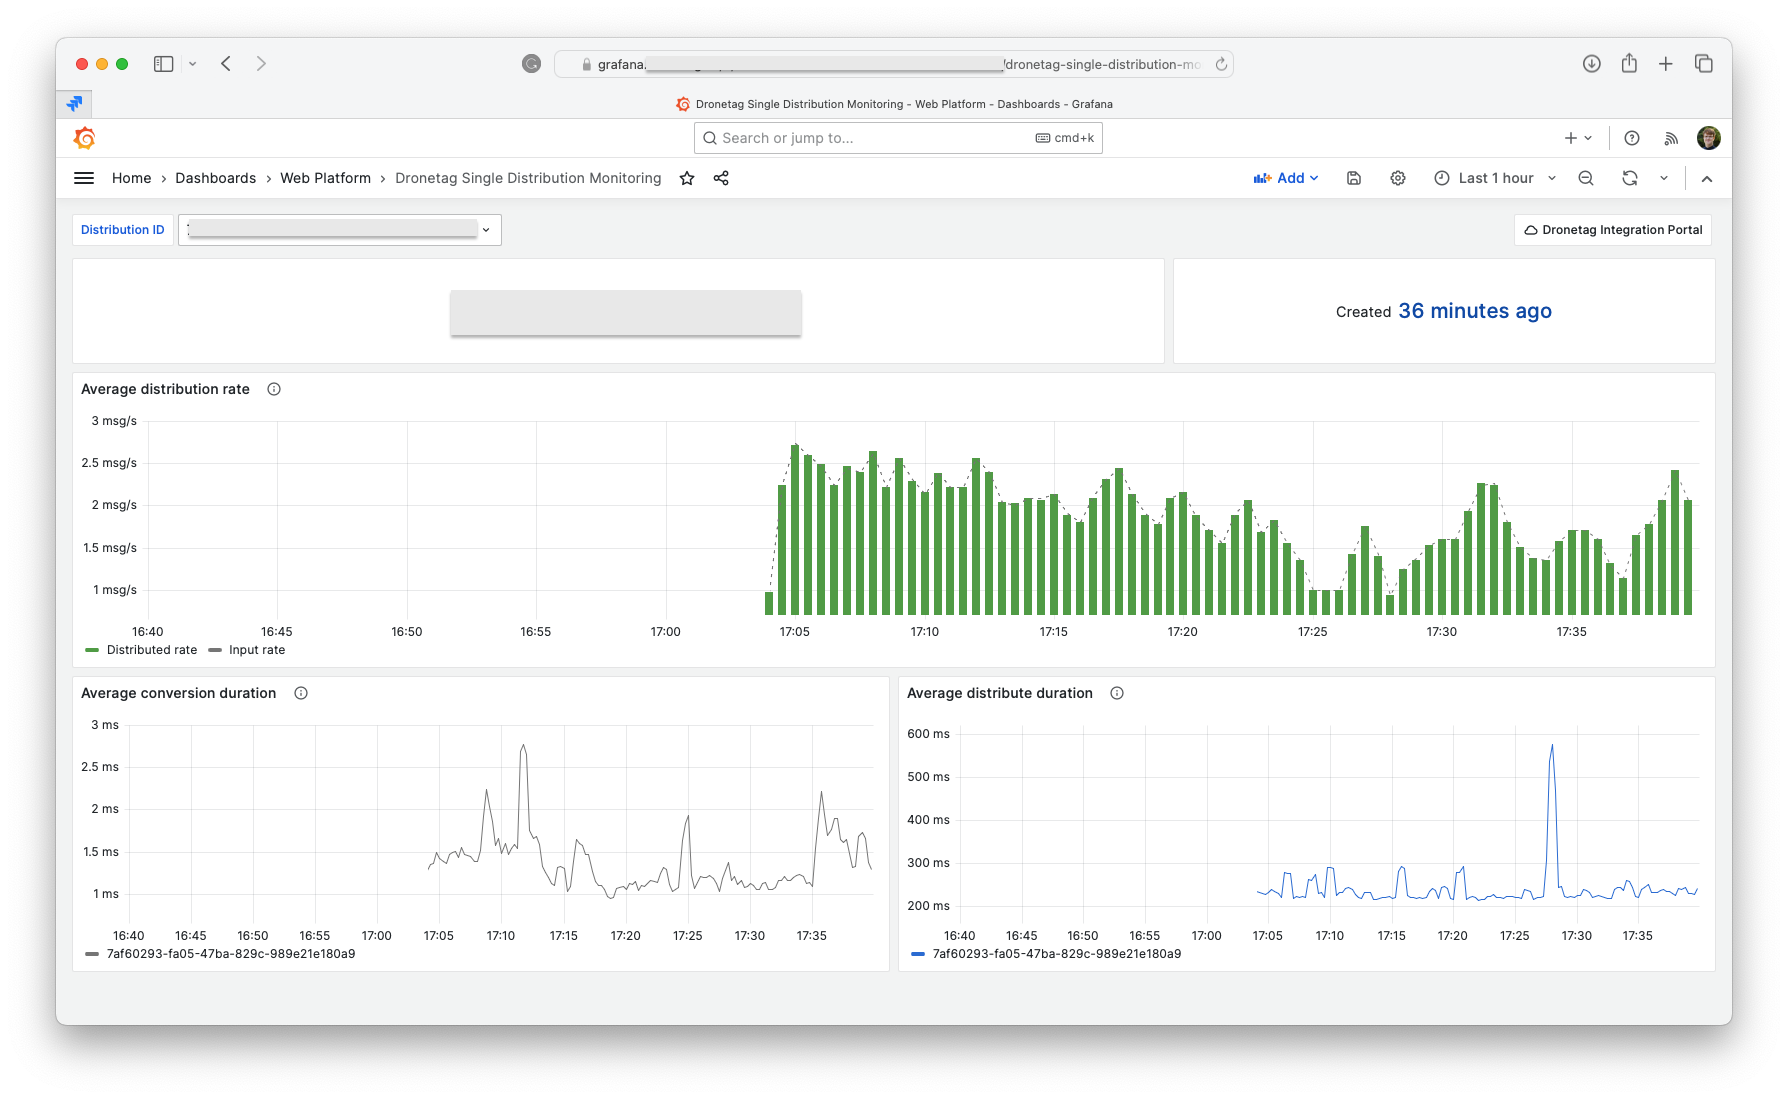
Ukázkový dashboard pro Grafanu
Připravili jsme jednoduchý ukázkový dashboard pro Grafanu. Soubor JSON můžete importovat do své instance Grafany a upravit podle svých potřeb.
Details
{ "annotations": { "list": [ { "builtIn": 1, "datasource": { "type": "grafana", "uid": "-- Grafana --" }, "enable": true, "hide": true, "iconColor": "rgba(0, 211, 255, 1)", "name": "Annotations & Alerts", "target": { "limit": 100, "matchAny": false, "tags": [], "type": "dashboard" }, "type": "dashboard" } ] }, "editable": true, "fiscalYearStartMonth": 0, "graphTooltip": 0, "id": 47, "links": [ { "asDropdown": false, "icon": "cloud", "includeVars": false, "keepTime": false, "tags": [], "targetBlank": false, "title": "Dronetag Integration Portal", "tooltip": "", "type": "link", "url": "https://integrations.dronetag.app" } ], "liveNow": false, "panels": [ { "datasource": { "type": "prometheus", "uid": "aRT0ZzYnk" }, "fieldConfig": { "defaults": { "color": { "mode": "thresholds" }, "mappings": [], "thresholds": { "mode": "absolute", "steps": [ { "color": "dark-purple", "value": null } ] }, "unit": "string" }, "overrides": [] }, "gridPos": { "h": 3, "w": 16, "x": 0, "y": 0 }, "id": 3, "options": { "colorMode": "value", "graphMode": "none", "justifyMode": "auto", "orientation": "horizontal", "reduceOptions": { "calcs": [ "lastNotNull" ], "fields": "/^relay_distribution_name$/", "values": false }, "text": { "valueSize": 40 }, "textMode": "value" }, "pluginVersion": "10.1.1", "targets": [ { "datasource": { "type": "prometheus", "uid": "aRT0ZzYnk" }, "editorMode": "code", "expr": "relay_messages_read_created{distribution_id=\"$distribution_id\"}", "format": "table", "instant": false, "legendFormat": "__auto", "range": true, "refId": "A" } ], "transformations": [], "type": "stat" }, { "datasource": { "type": "prometheus", "uid": "aRT0ZzYnk" }, "fieldConfig": { "defaults": { "color": { "mode": "thresholds" }, "mappings": [], "thresholds": { "mode": "absolute", "steps": [ { "color": "green", "value": null }, { "color": "dark-blue", "value": 80 } ] }, "unit": "dateTimeFromNow" }, "overrides": [] }, "gridPos": { "h": 3, "w": 8, "x": 16, "y": 0 }, "id": 2, "options": { "colorMode": "value", "graphMode": "none", "justifyMode": "center", "orientation": "horizontal", "reduceOptions": { "calcs": [ "lastNotNull" ], "fields": "/^Created$/", "values": false }, "textMode": "value_and_name" }, "pluginVersion": "10.1.1", "targets": [ { "datasource": { "type": "prometheus", "uid": "aRT0ZzYnk" }, "editorMode": "code", "expr": "relay_messages_read_created{distribution_id=\"$distribution_id\"}", "format": "time_series", "instant": false, "legendFormat": "Created at", "range": true, "refId": "A" } ], "transformations": [ { "id": "calculateField", "options": { "alias": "Created", "binary": { "left": "Created at", "operator": "*", "reducer": "sum", "right": "1000" }, "mode": "binary", "reduce": { "reducer": "sum" }, "replaceFields": true } } ], "type": "stat" }, { "datasource": { "type": "prometheus", "uid": "aRT0ZzYnk" }, "description": "Average rates of sent (distributed) messages. Dotted line shows source input rate, which can be higher if there are filters applied (such as filter to specific device group).", "fieldConfig": { "defaults": { "color": { "mode": "palette-classic" }, "custom": { "axisCenteredZero": false, "axisColorMode": "text", "axisLabel": "", "axisPlacement": "auto", "barAlignment": 0, "drawStyle": "bars", "fillOpacity": 100, "gradientMode": "none", "hideFrom": { "legend": false, "tooltip": false, "viz": false }, "insertNulls": false, "lineInterpolation": "linear", "lineWidth": 0, "pointSize": 5, "scaleDistribution": { "type": "linear" }, "showPoints": "never", "spanNulls": false, "stacking": { "group": "A", "mode": "none" }, "thresholdsStyle": { "mode": "off" } }, "mappings": [], "thresholds": { "mode": "absolute", "steps": [ { "color": "green", "value": null }, { "color": "red", "value": 80 } ] }, "unit": "mps" }, "overrides": [ { "matcher": { "id": "byName", "options": "Input rate" }, "properties": [ { "id": "custom.lineWidth", "value": 1 }, { "id": "custom.lineStyle", "value": { "dash": [ 2, 6 ], "fill": "dot" } }, { "id": "color", "value": { "mode": "fixed" } }, { "id": "custom.drawStyle", "value": "line" }, { "id": "custom.fillOpacity", "value": 0 } ] } ] }, "gridPos": { "h": 8, "w": 24, "x": 0, "y": 3 }, "id": 1, "interval": "15s", "maxDataPoints": 128, "options": { "legend": { "calcs": [], "displayMode": "list", "placement": "bottom", "showLegend": true }, "tooltip": { "mode": "single", "sort": "none" } }, "targets": [ { "datasource": { "type": "prometheus", "uid": "aRT0ZzYnk" }, "editorMode": "code", "expr": "sum(rate(relay_messages_distributed_total{distribution_id=\"$distribution_id\"}[$__rate_interval])) by (distribution_id)", "instant": false, "legendFormat": "Distributed rate", "range": true, "refId": "A" }, { "datasource": { "type": "prometheus", "uid": "aRT0ZzYnk" }, "editorMode": "code", "expr": "sum(rate(relay_messages_read_total{distribution_id=\"$distribution_id\"}[$__rate_interval])) by (distribution_id)", "hide": false, "instant": false, "legendFormat": "Input rate", "range": true, "refId": "B" } ], "title": "Average distribution rate", "type": "timeseries" }, { "datasource": { "type": "prometheus", "uid": "aRT0ZzYnk" }, "description": "The duration of how long it takes to convert the source input data to the output format. Includes filtering or other data pre-processing.", "fieldConfig": { "defaults": { "color": { "mode": "fixed", "seriesBy": "last" }, "custom": { "axisCenteredZero": false, "axisColorMode": "text", "axisLabel": "", "axisPlacement": "auto", "barAlignment": 0, "drawStyle": "line", "fillOpacity": 0, "gradientMode": "none", "hideFrom": { "legend": false, "tooltip": false, "viz": false }, "insertNulls": false, "lineInterpolation": "linear", "lineWidth": 1, "pointSize": 5, "scaleDistribution": { "type": "linear" }, "showPoints": "auto", "spanNulls": false, "stacking": { "group": "A", "mode": "none" }, "thresholdsStyle": { "mode": "line" } }, "mappings": [], "thresholds": { "mode": "absolute", "steps": [ { "color": "blue", "value": null } ] }, "unit": "s" }, "overrides": [] }, "gridPos": { "h": 8, "w": 12, "x": 0, "y": 11 }, "id": 4, "interval": "15s", "options": { "legend": { "calcs": [], "displayMode": "list", "placement": "bottom", "showLegend": true }, "tooltip": { "mode": "single", "sort": "none" } }, "targets": [ { "datasource": { "type": "prometheus", "uid": "aRT0ZzYnk" }, "editorMode": "code", "expr": "sum(rate(relay_message_conversion_seconds_sum{distribution_id=\"$distribution_id\"}[$__rate_interval]) / rate(relay_message_conversion_seconds_count{distribution_id=\"$distribution_id\"}[$__rate_interval])) by (distribution_id)", "instant": false, "legendFormat": "__auto", "range": true, "refId": "A" } ], "title": "Average conversion duration", "type": "timeseries" }, { "datasource": { "type": "prometheus", "uid": "aRT0ZzYnk" }, "description": "The duration of how long it takes to distribute the data. The largest part is usually the server latency. Some distribution types can be missing a support for this metric.", "fieldConfig": { "defaults": { "color": { "mode": "thresholds", "seriesBy": "max" }, "custom": { "axisCenteredZero": false, "axisColorMode": "text", "axisLabel": "", "axisPlacement": "auto", "barAlignment": 0, "drawStyle": "line", "fillOpacity": 0, "gradientMode": "none", "hideFrom": { "legend": false, "tooltip": false, "viz": false }, "insertNulls": false, "lineInterpolation": "linear", "lineWidth": 1, "pointSize": 5, "scaleDistribution": { "type": "linear" }, "showPoints": "auto", "spanNulls": false, "stacking": { "group": "A", "mode": "none" }, "thresholdsStyle": { "mode": "dashed" } }, "mappings": [], "thresholds": { "mode": "absolute", "steps": [ { "color": "blue", "value": null }, { "color": "dark-orange", "value": 0.7 }, { "color": "semi-dark-red", "value": 1 } ] }, "unit": "s" }, "overrides": [] }, "gridPos": { "h": 8, "w": 12, "x": 12, "y": 11 }, "id": 5, "interval": "15s", "options": { "legend": { "calcs": [], "displayMode": "list", "placement": "bottom", "showLegend": true }, "tooltip": { "mode": "single", "sort": "none" } }, "targets": [ { "datasource": { "type": "prometheus", "uid": "aRT0ZzYnk" }, "editorMode": "code", "expr": "sum(rate(relay_message_distribution_seconds_sum{distribution_id=\"$distribution_id\"}[$__rate_interval]) / rate(relay_message_distribution_seconds_count{distribution_id=\"$distribution_id\"}[$__rate_interval])) by (distribution_id)", "instant": false, "legendFormat": "__auto", "range": true, "refId": "A" } ], "title": "Average distribute duration", "type": "timeseries" } ], "refresh": "", "schemaVersion": 38, "style": "dark", "tags": [ "dronetag" ], "templating": { "list": [ { "current": { "selected": false, "text": "cc2129b7-30e4-469e-8b13-92e7e097d528", "value": "cc2129b7-30e4-469e-8b13-92e7e097d528" }, "datasource": { "type": "prometheus", "uid": "aRT0ZzYnk" }, "definition": "label_values(relay_messages_read_total,distribution_id)", "hide": 0, "includeAll": false, "label": "Distribution ID", "multi": false, "name": "distribution_id", "options": [], "query": { "query": "label_values(relay_messages_read_total,distribution_id)", "refId": "PrometheusVariableQueryEditor-VariableQuery" }, "refresh": 1, "regex": "", "skipUrlSync": false, "sort": 0, "type": "query" } ] }, "time": { "from": "now-1h", "to": "now" }, "timepicker": { "nowDelay": "", "refresh_intervals": [ "5s", "10s", "30s", "1m", "5m" ] }, "timezone": "", "title": "Dronetag Single Distribution Monitoring", "uid": "f2370455-bdac-4098-baf5-ea8857bc199d", "version": 5, "weekStart": "" }